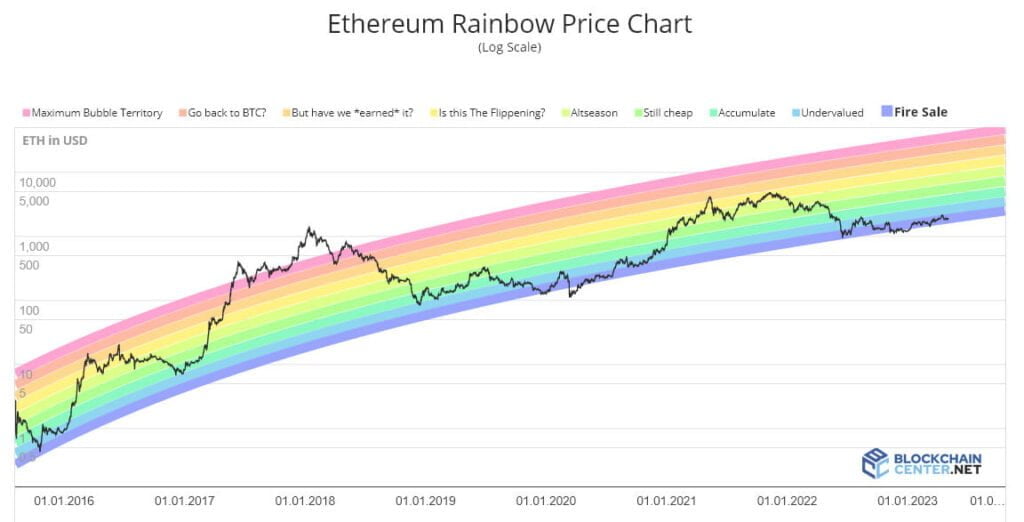
The Ethereum Rainbow Chart is a popular technical analysis tool used by traders to visualize the long-term trend of Ethereum. The chart is named after its colorful appearance, which features a rainbow spectrum of colors.
What is the Ethereum Rainbow Chart?
A moving average chart called the Rainbow Chart uses two exponential moving averages (EMA) over a considerable amount of time. The 30-week EMA and the 60-week EMA are the two EMAs that are used. The chart has these EMAs plotted, and the gaps between them are colored in the rainbow.
How to read Ethereum Rainbow Chart?
The colors of the Rainbow Chart correspond to different market conditions, such as bullish or bearish, and can help traders identify potential buying or selling opportunities.
The significance of each color in the Rainbow Chart is as follows:
Dark Red
This color represents an extremely bearish market condition, similar to the red color. It indicates that the price of the asset is significantly below its long-term moving averages and is likely to continue declining.
Red
This color represents a bearish market condition. It indicates that the price of the asset is below its long-term moving averages and is likely to continue declining.
Orange
This color represents a slightly bearish or neutral market condition. It indicates that the price of the asset is close to its long-term moving averages and may begin to reverse and move upwards.
Yellow
This color represents a neutral market condition. It indicates that the price of the asset is trading around its long-term moving averages and is not showing any clear trend.
Light Green
This color represents a slightly bullish or neutral market condition. It indicates that the price of the asset is close to its long-term moving averages and may begin to reverse and move downwards.
Green
This color represents a bullish market condition. It indicates that the price of the asset is above its long-term moving averages and is likely to continue rising.
Dark Green
This color represents an extremely bullish market condition, similar to the light green color. It indicates that the price of the asset is significantly above its long-term moving averages and is likely to continue rising.
Blue Green
This color represents an overbought market condition. It indicates that the price of the asset is significantly above its long-term moving averages and may be due for a correction or pullback.
Blue
This color represents an oversold market condition. It indicates that the price of the asset is significantly below its long-term moving averages and may be due for a reversal or bounce.
Benefits and Limitations of the Ethereum Rainbow Chart
The Ethereum Rainbow Chart provides a number of advantages, including offering a visual representation of Ethereum’s past price changes and assisting traders and investors in making decisions based on trends seen. The chart does, however, have some drawbacks, such as being a lagging indicator and failing to take into account additional elements that could affect the price of Ethereum, such as news events and governmental developments.
Final Thoughts
The Ethereum Rainbow Chart is a useful tool for tracking the price movements of Ethereum over time. It uses a color-coded system that makes it easy to read and interpret, and can be a useful tool for making informed investment decisions. However, it should not be relied upon as the sole indicator for predicting the future price of Ethereum. Other factors such as market sentiment, global events, and technology advancements must also be considered.
If you’re interested in investing in Ethereum, it’s important to conduct thorough research and consult with a financial advisor before making any investment decisions.
Thank you for reading our comprehensive guide to the Ethereum Rainbow Chart. We hope that it has been helpful in providing a better understanding of this useful tool for cryptocurrency investors.
FAQs
Q1: What is Ethereum Rainbow Chart?
A: The Ethereum Rainbow Chart is a graphical representation of the historical price movements of Ethereum, one of the leading cryptocurrencies in the market.
Q2: How does the Ethereum Rainbow Chart work?
A: The Ethereum Rainbow Chart comprises seven different color bands, each of which represents a particular price range of Ethereum.
Q3: Is the Ethereum Rainbow Chart a reliable tool for predicting future price movements?
A: The Ethereum Rainbow Chart is not a perfect tool for predicting future price movements. It is a lagging indicator and does not account for other factors that can influence the price of Ethereum. Therefore, investors and traders should use it in conjunction with other indicators and market analysis.
Q4: Can I use the Ethereum Rainbow Chart for other cryptocurrencies?
A: The Ethereum Rainbow Chart is specifically designed for Ethereum and may not be suitable for other cryptocurrencies. However, similar charting techniques can be applied to other cryptocurrencies to identify trends and make informed decisions.